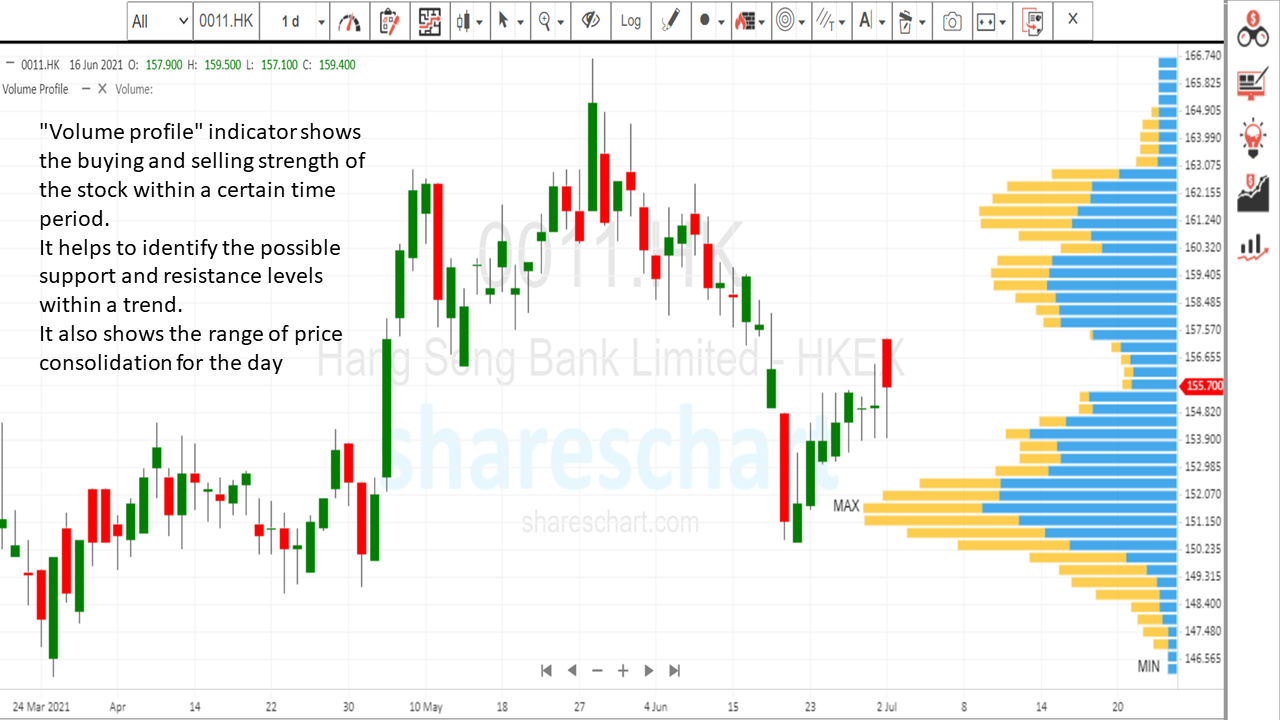
“Volume profile” indicator shows the buying and selling strength of the stock within a certain time period.
It helps to identify the possible support and resistance levels within a trend.
It also shows the range of price consolidation for the day.
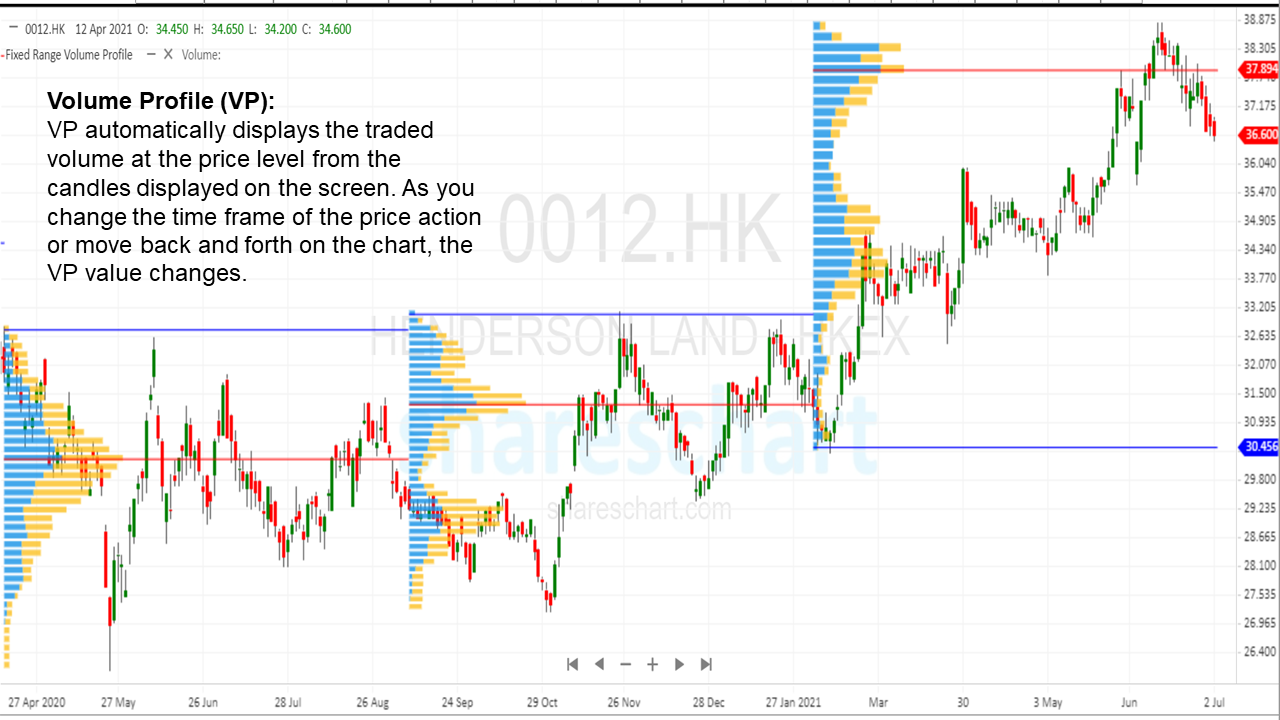
Volume Profile (VP):
VP automatically displays the traded volume at the price level from the candles displayed on the screen. As you change the time frame of the price action or move back and forth on the chart, the VP value changes.
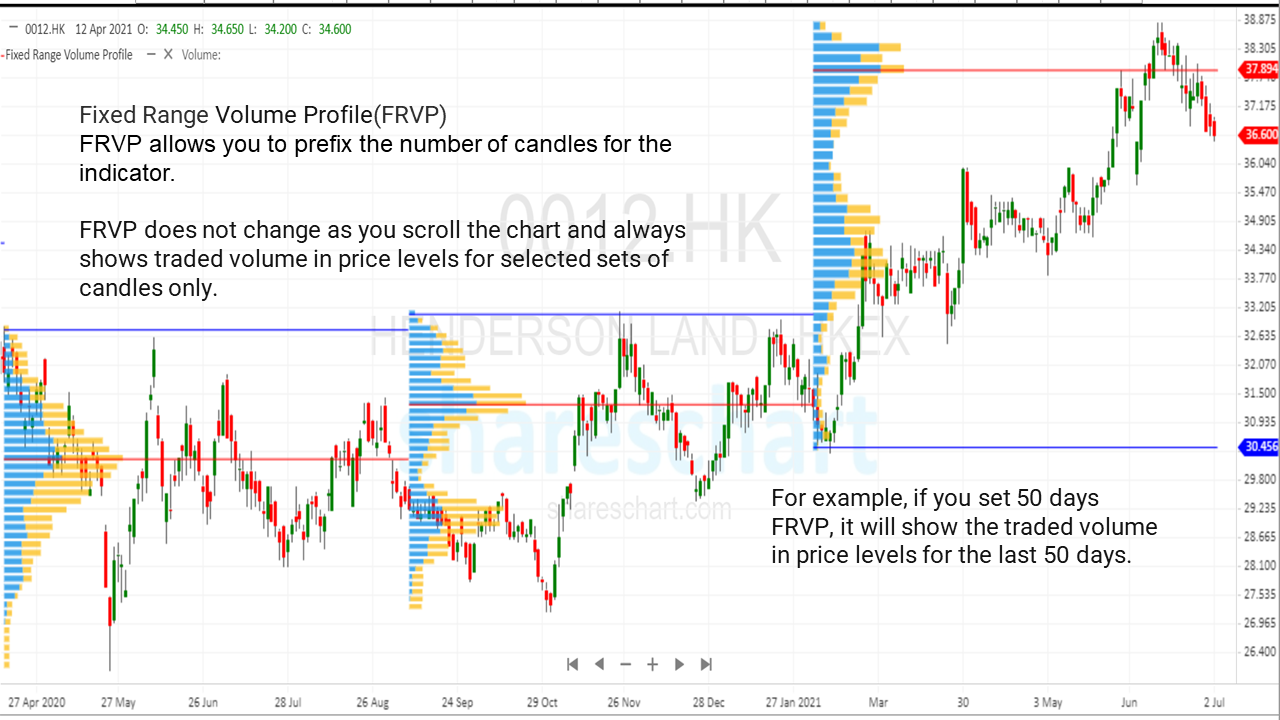
Fixed Rage Volume Profile(FRVP)
FRVP allows you to prefix the number of candles for the indicator.
FRVP does not change as you scroll the chart and always shows traded volume in price levels for selected sets of candles only.
For example, if you set 50 days FRVP, it will show the traded volume in price levels for the last 50 days.
Fixed Time Frame Volume Profile (FTFVP)
Fixed Time Frame Volume Profile shows the volume profile for all sessions displayed in a chart. You will see a split volume profile for each session displayed in the chart.
You can change an hour, a day, a week, etc. for each session and it is the same with changing the time period of the chart.
Technical terms for volume profile analysis
Value Area (VA): 70% of the volume can be found here. The volume profile becomes a bit more complex in this range. This means that 70% of the total volume on the chart occurred cumulatively at these price levels, hence the name Value Area.
Value Area High (VAH): This is the highest point in the value area section.
Value Area Low (VAL): This is the lowest point in the value area section.
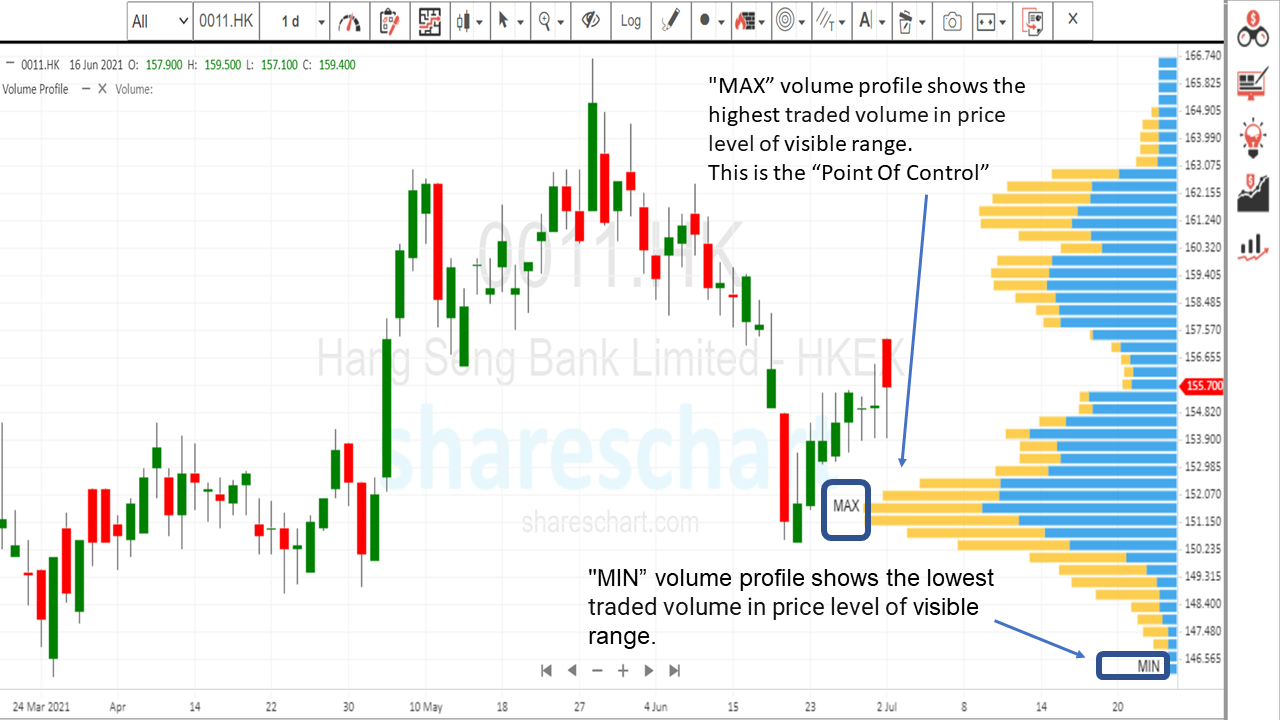
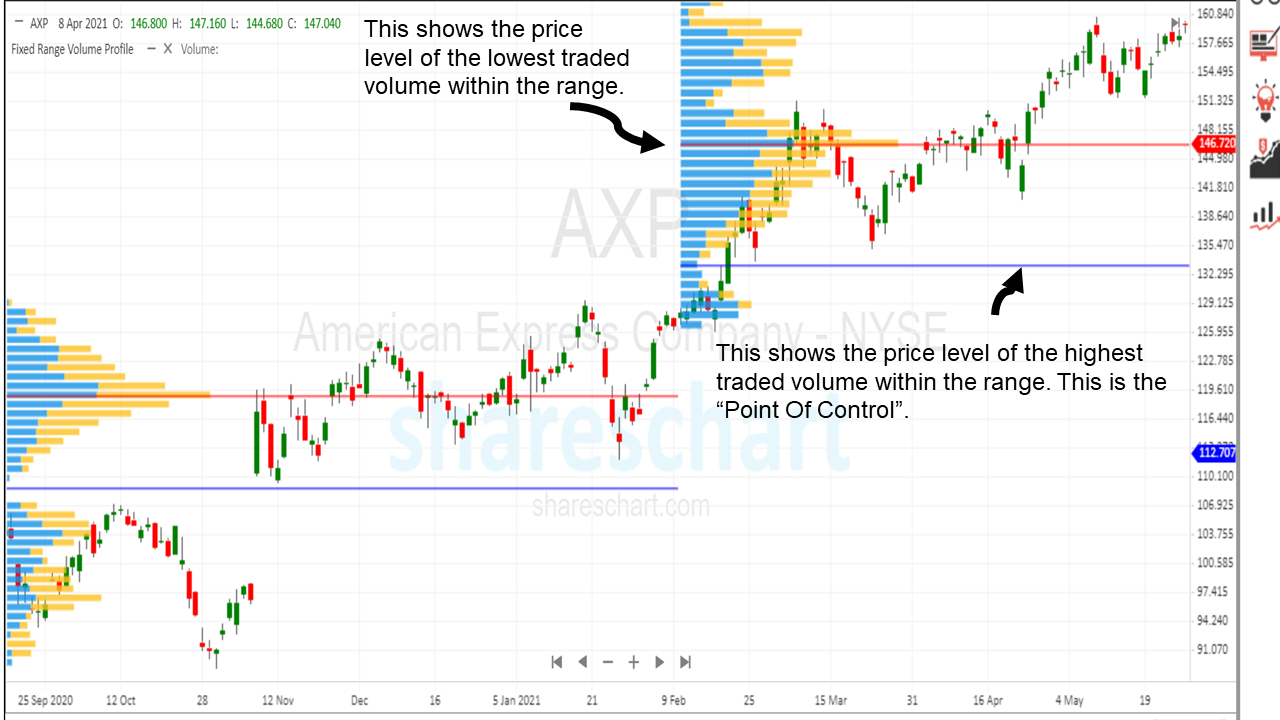
Point of Control (POC): This is the highest volume node present on the volume profile. This is where numerous volumes are transacted. Traders use the POC as an important checkpoint and support.
A Developing Value Area is an area of value that changes over time. You can see how the value range changes over time by looking at Developing VA.
Developing VA is determined on the price action and is indicated by two lines showing both Value Area High and Value Area Low over time.
Developing Point of Control (Developing POC): This is a change in POC over time. As the POC changes over time, you can notice the change by watching the Developing POC line to what it was in the past.
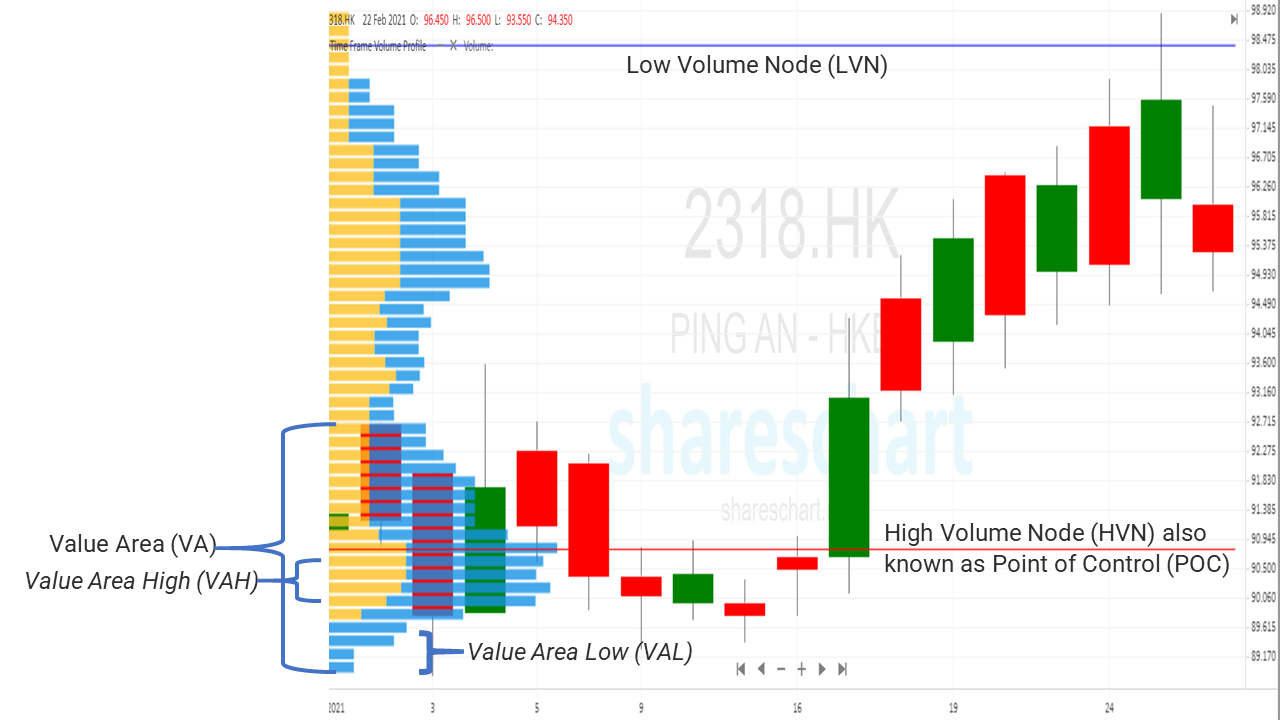
High Volume Node (HVN):
An HVN or High Volume Node is a point in the volume profile where there is a significantly higher volume than average.
The most important feature of the volume profile is to show the most traded prices for specific time periods, and that is exactly what an HVN is. A lot of volume is traded at these prices. HVNs are much longer than the other bars around them (remember, these are all relative to other bars).
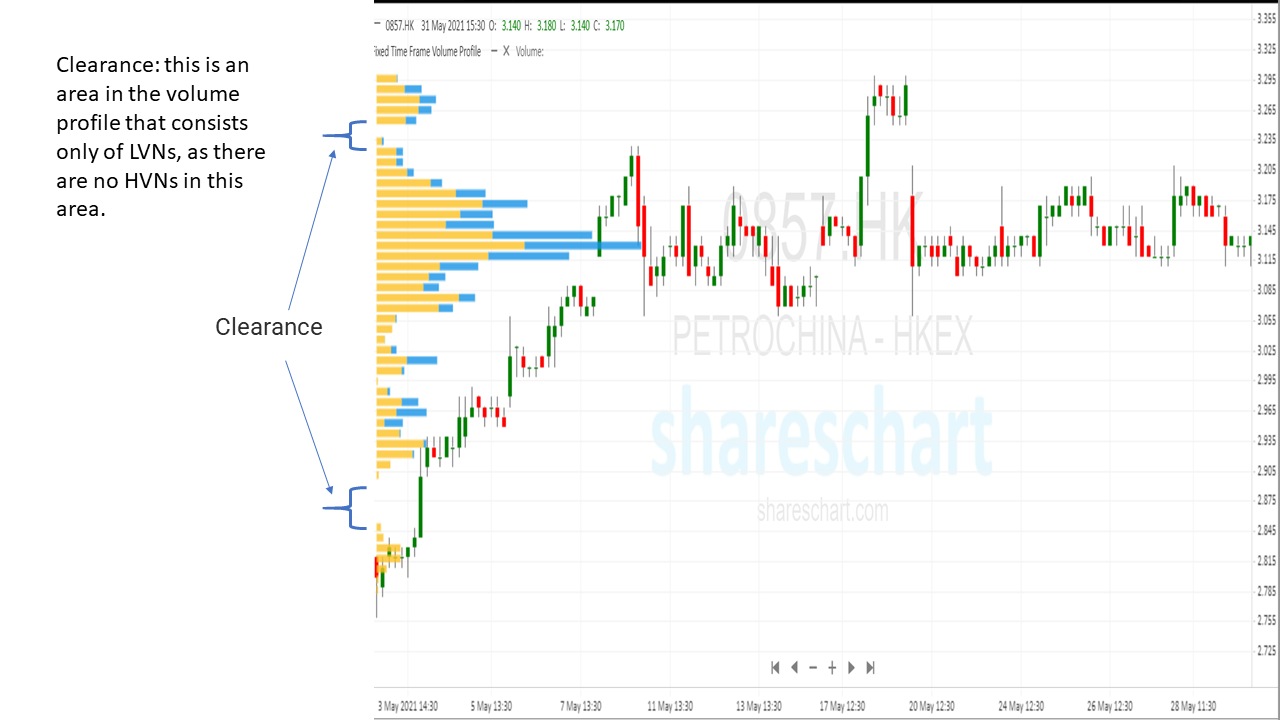
Low Volume Node (LVN):
An LVN or Low Volume Node is a point in the volume profile where there is significantly less volume than average. LVNs are the inverse of HVNs. Not much volume is exchanged at these bars (or prices)
The five different volume profile structure:
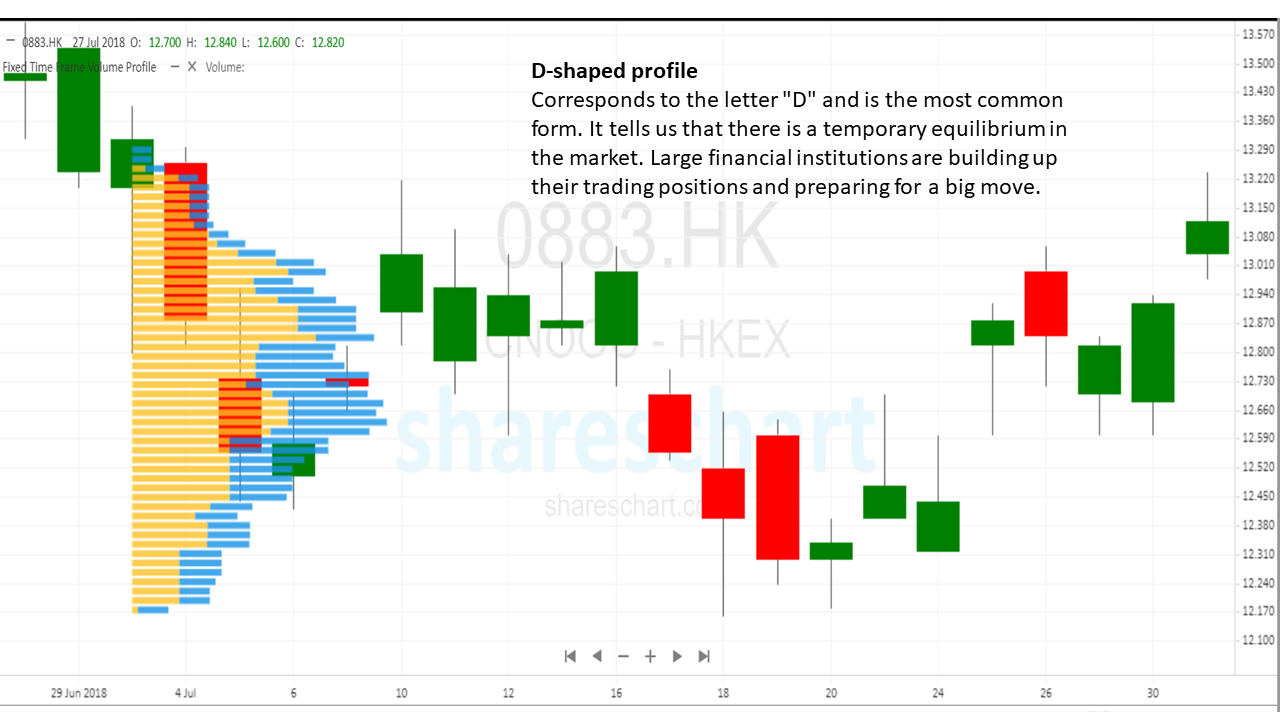
D-shaped profile
D-shaped profile Corresponds to the letter “D” and is the most common form. It tells us that there is a temporary equilibrium in the market. Large financial institutions are building up their trading positions and preparing for a big move.
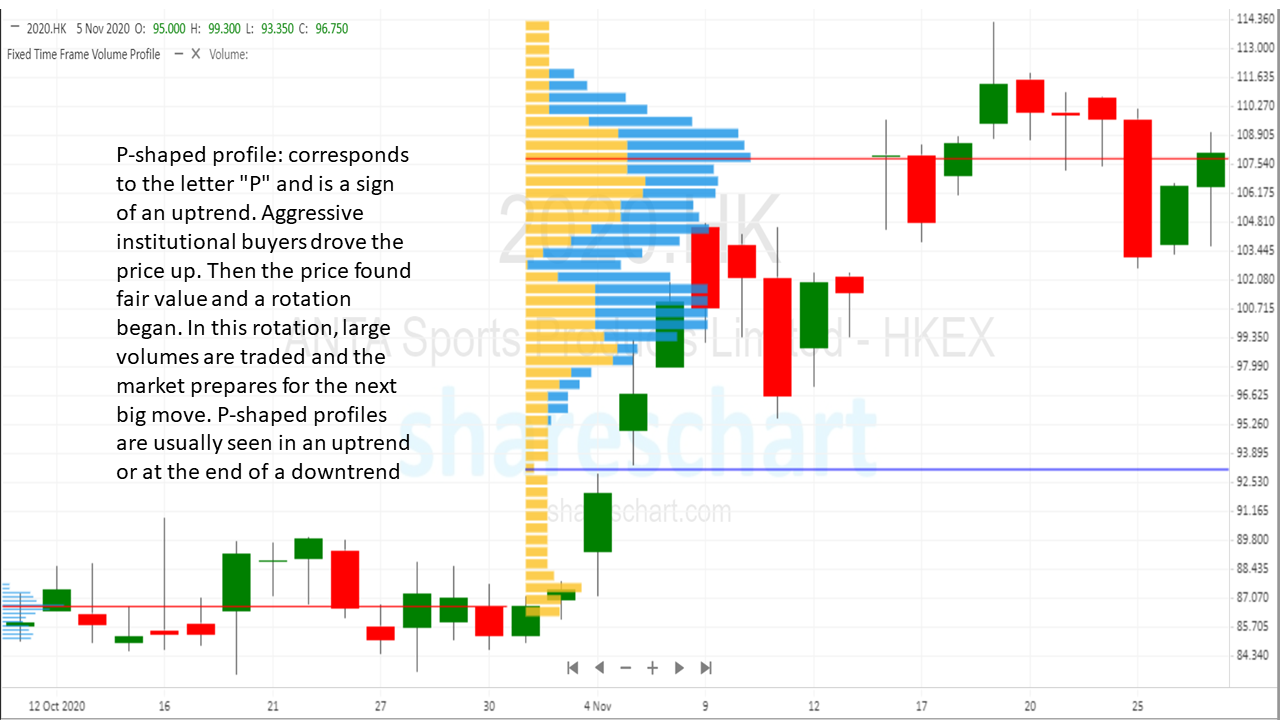
P-shaped profile
P-shaped profile: corresponds to the letter “P” and is a sign of an uptrend. Aggressive institutional buyers drove the price up. Then the price found fair value and a rotation began. In this rotation, large volumes are traded and the market prepares for the next big move. P-shaped profiles are usually seen in an uptrend or at the end of a downtrend
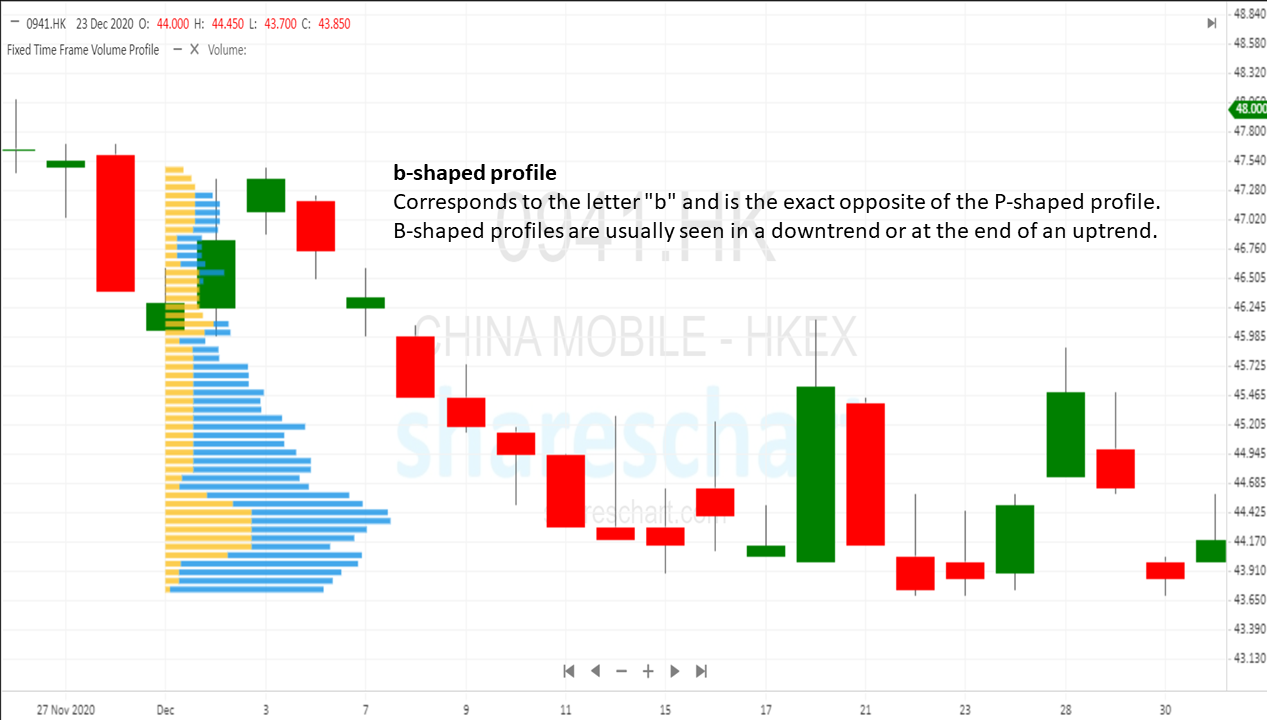
b-shaped profile
b-shaped profile corresponds to the letter “b” and is the exact opposite of the P-shaped profile. B-shaped profiles are usually seen in a downtrend or at the end of an uptrend.
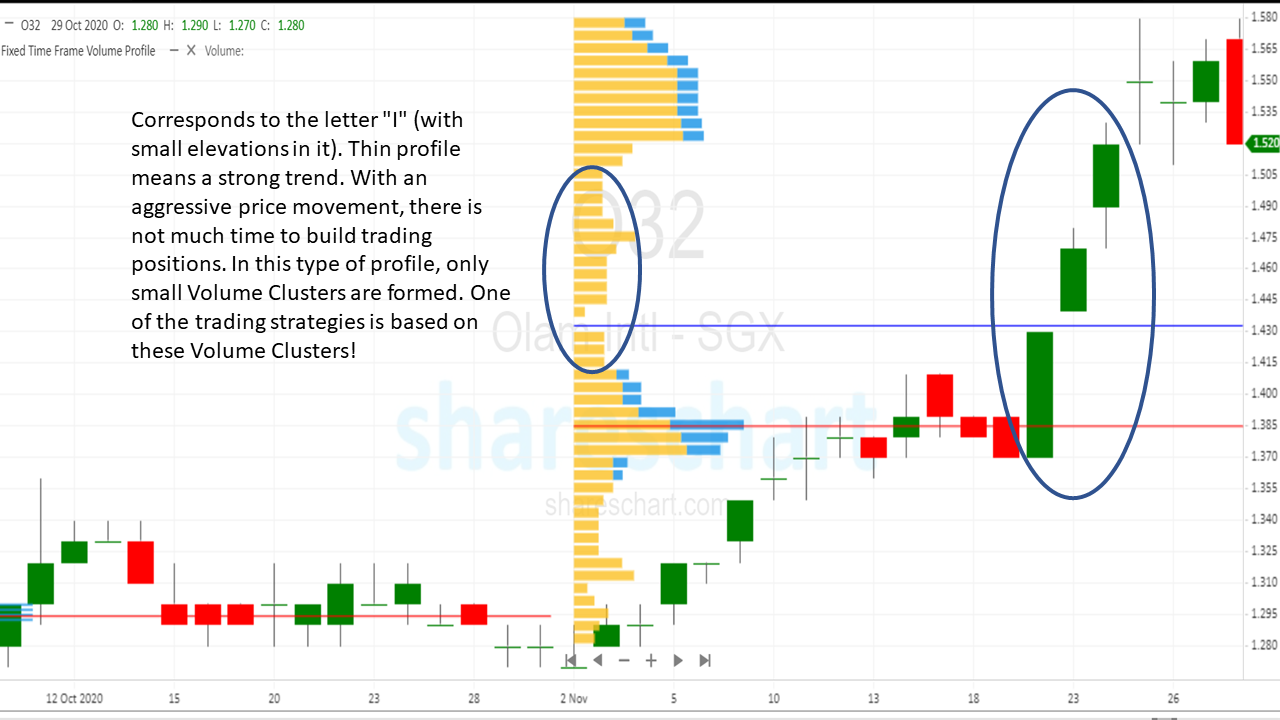
Thin profile
Corresponds to the letter “I” (with small elevations in it). Thin profile means a strong trend. With an aggressive price movement, there is not much time to build trading positions. In this type of profile, only small Volume Clusters are formed. One of the trading strategies is based on these Volume Clusters!
B-shaped Volume Profile
A B-shaped Volume Profile occurs when two D-shaped profiles occur within a given period. Although there is only one value range and POC, some order flow traders will split the profile into 2 separate “D-ranges” with their own value ranges. While B-shaped profiles are generally interpreted as a continuation of a trend, it is important to note which POC is more dominant – indicating whether activity was greatest at the top or bottom of the profile.