Marvell Technology, Inc is a storage controllers for hard disk drives (HDD) and solid-state drives that support a variety of host system interfaces, including serial attached SCSI (SAS), serial advanced technology attachment (SATA), peripheral component interconnect express, non-volatile memory express (NVMe), and NVMe over fabrics; and fiber channel products, including Server and storage system communication need host bus adapters and controllers.
Recent news:
Innovium, a networking chip start-up, is set to be acquired by Marvell Technology for $1.1 billion. Marvell announced the transaction early Tuesday to gain a larger piece of the silicon used to power the world’s largest and most complicated data centers. The market for Ethernet switch chips inside data centers, which is Marvell’s major business, might quadruple to $2 billion in the next five years, according to Marvell CEO Matt Murphy. “However, hyperscale definitely grows at a rate of 20% to 30% every year, so it’s rather significant.”
Upcoming result announcement:
When Marvell Technology (MRVL) releases its results for the quarter ended July 2021, it is predicted to show a year-over-year gain in earnings on increased revenues. On August 26, 2021, the earnings report is likely to be released. In its forthcoming report, this chipmaker is predicted to record quarterly earnings of $0.31 per share, representing a year-over-year increase of 47.6%. The company expects $1.07 billion in revenue, up 46.5 percent from the previous quarter.
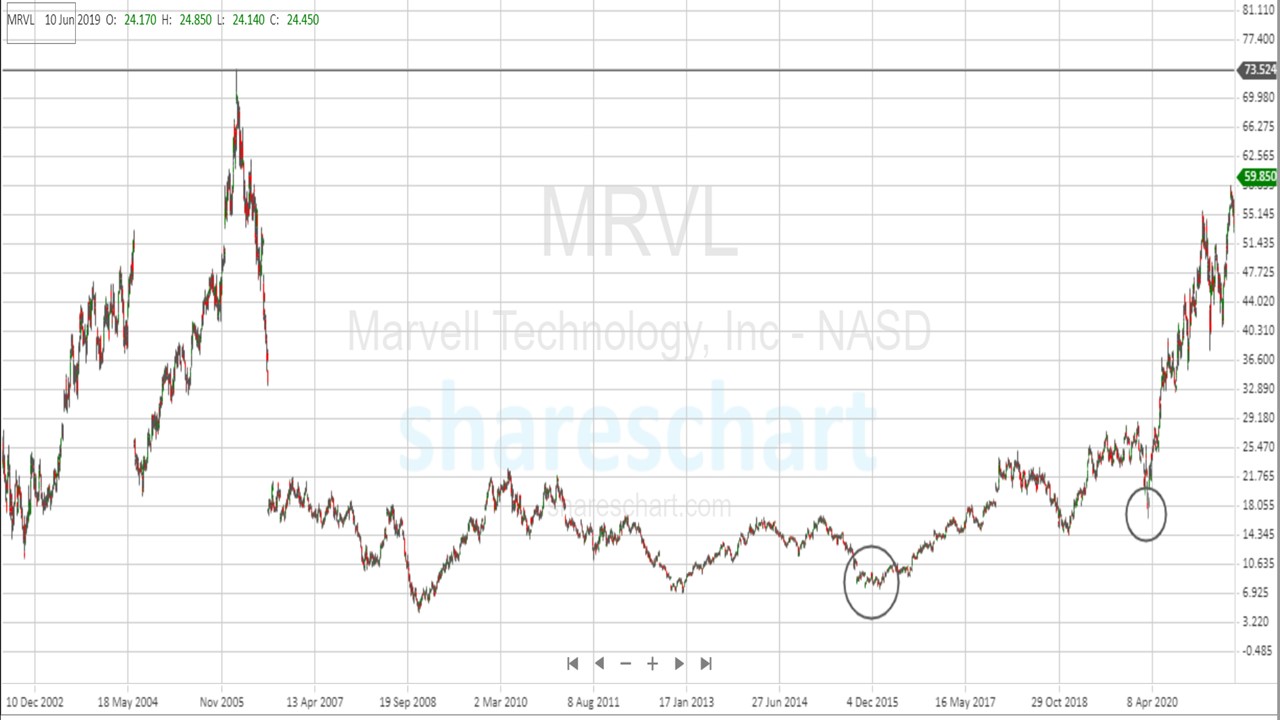
Marvell Technology Inc.’s stock price has risen a whopping 800% over the past 6 years, representing an annualized return of 130%. In fact, the stock price went from less than $40 in May of this year to over $60 in August of this year, an increase of more than 50% in the last 3 months.
It is every investor’s dream to discover such jewels before the stock price starts to rise. Although not every investor is able to buy such stocks at the low point, technical analysis offers investors many opportunities to go with the trend and still make a handsome profit from such bullish stocks.
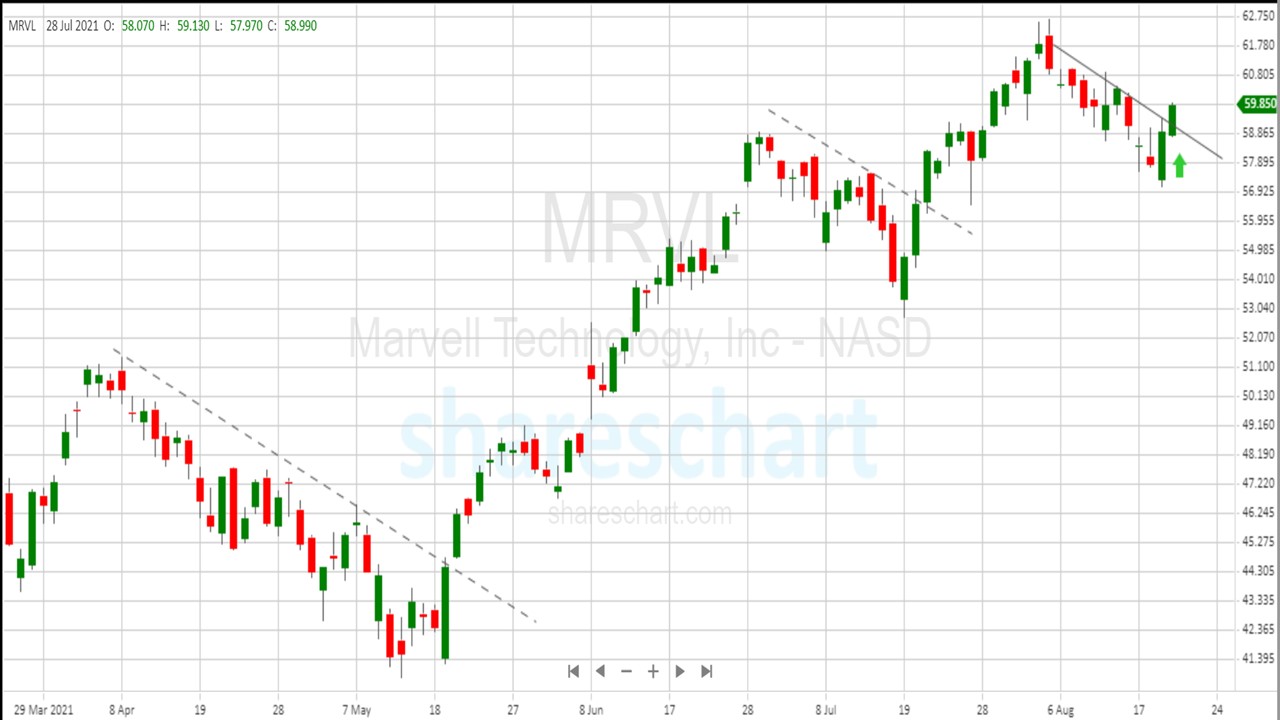
Last Friday, August 20, the price of Marvell Technology Inc. broke out again from the downtrend that began earlier this month. This is a bullish signal that has been picked up by ShareChart scanner. Among many other features, ShareChart scanner can look for trendlines as well as indicator breakout signals. It warns investors to buy these stocks in the early stages of the breakout.
To understand the degree of strength of the trend breakout, we refer to the past similar events when the price broke out of the downtrend on May 20 and July 21 this year. In both cases, the price rose between 13% and 31%. Considering that it took only 12 to 29 days to achieve such returns, these are attractive trading opportunities. Therefore, investors should take the opportunity to enter the long trade now when the price has similarly broken out of the downtrend.
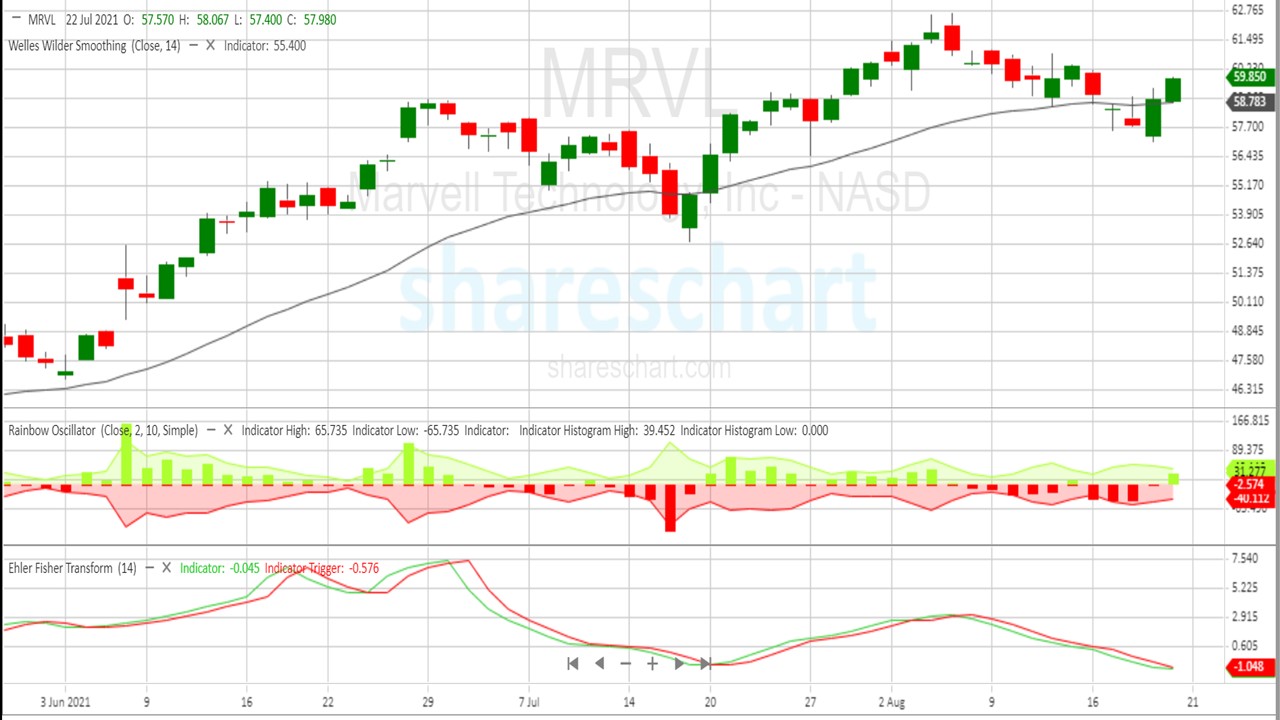
Next, we use indicators to check the strength of the breakout and determine if they are a good set-up. Price has broken out above the indicator Welles Wilder Smoothing while the rainbow indicator has turned from negative to positive.
The Ehler-Fisher Transform indicator was also close to forming a golden cross. From the above chart, the price tends to go up whenever the 3 indicators show bullish signs and vice versa. These 3 standard indicators from Shareschart.com confirm that now is a good time to invest in a stock.
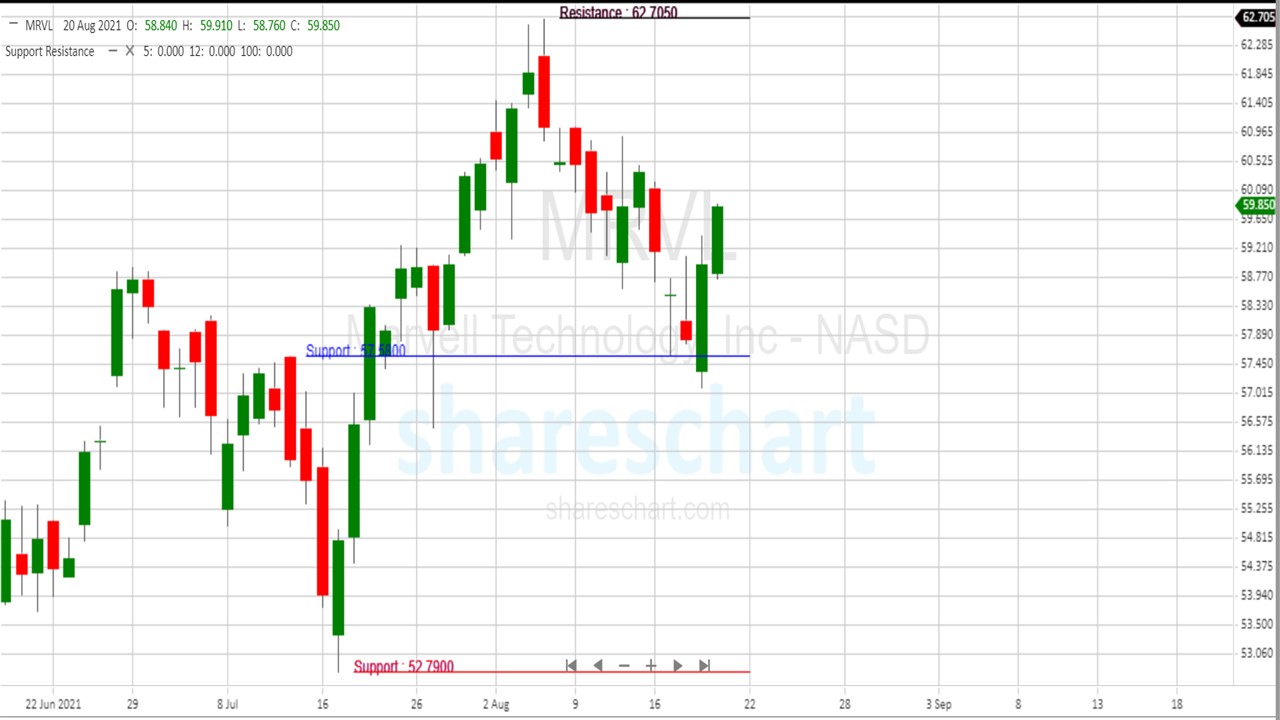
Next, the SharesChart Support/Resistance indicator shows the next potential target and stop loss levels. The next price target is $62.70 and the stop loss is $67.58.
The target price was the highest price reached in early August. The Support/Resistance indicator is one of Shareschart.com’s proprietary indicators, available for free to all users of this web-based charting software.
If a trader were to buy Marvell Technology Inc. at current levels and the stock price actually reached the $62.70 price target in the next few weeks, he would realize a potential profit of about 9%.
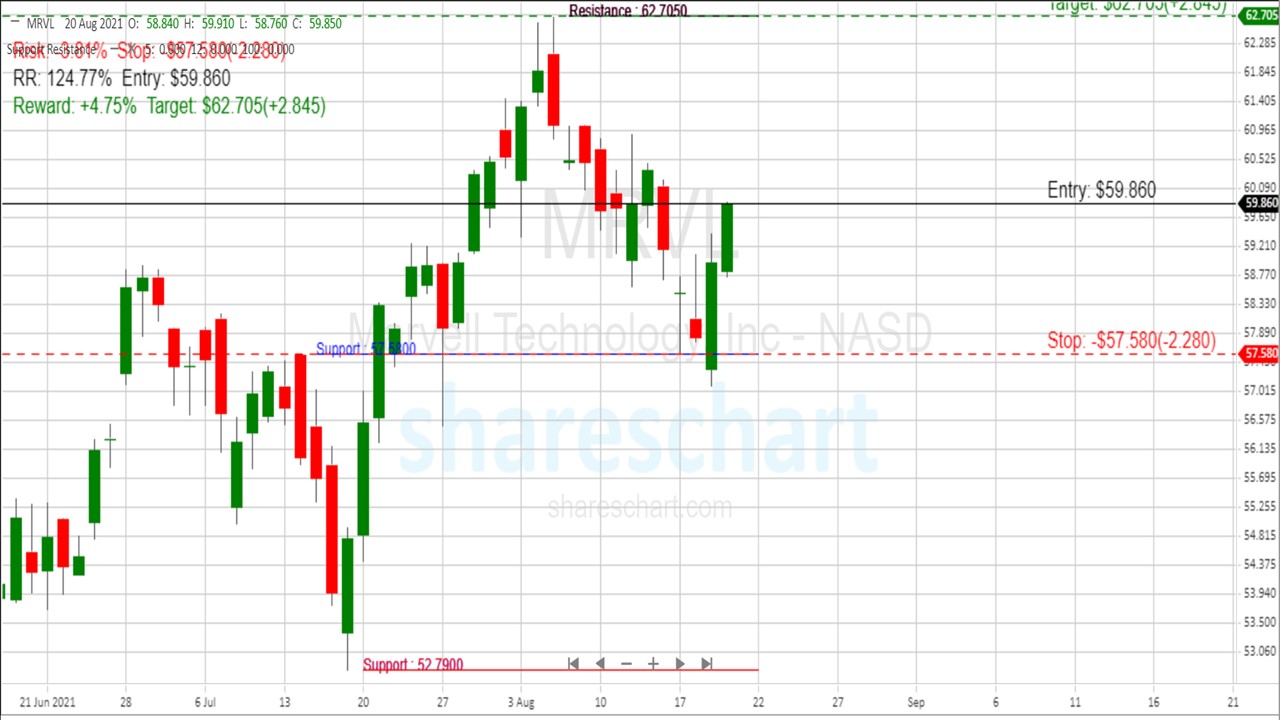
If an investor were to make a purchase based on the trade setup with a price target of $62.70 and a stop loss of $67.58, the risk-reward ratio would be approximately 124%. This is considered a good trade setup, as a risk-reward ratio greater than 100% is considered good.
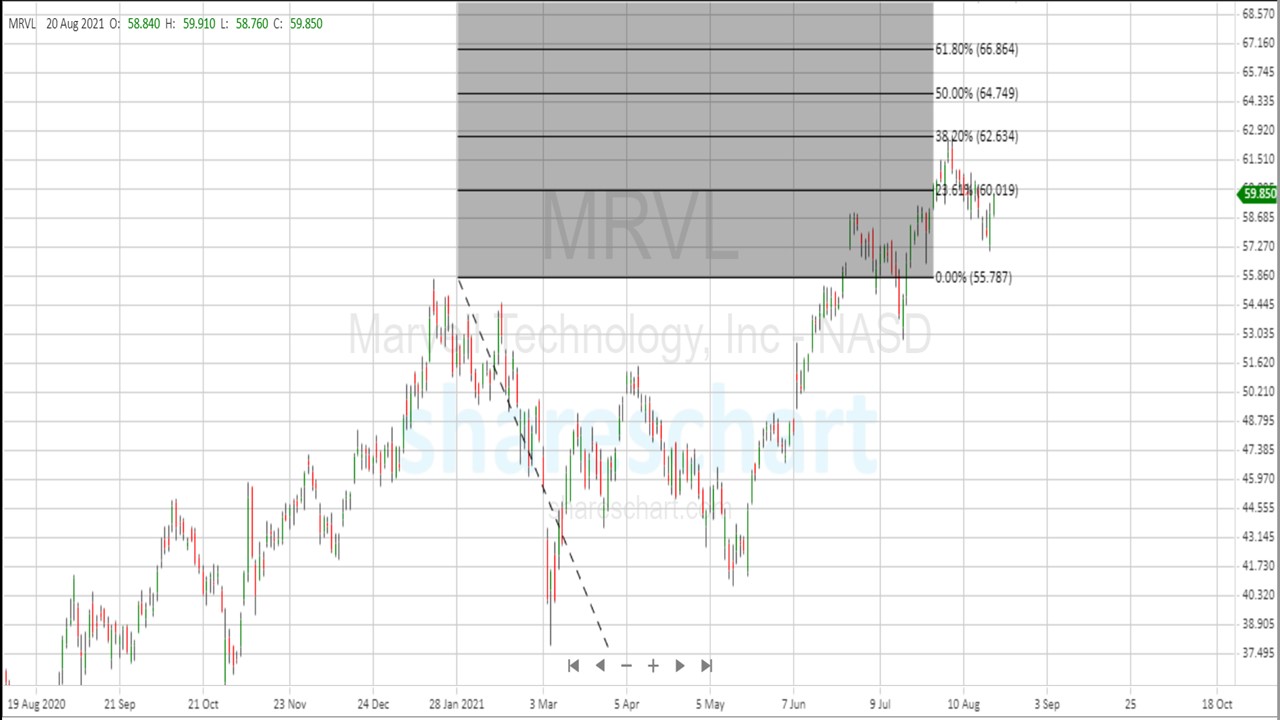
Looking beyond the immediate price target of $62.70, the next potential price target is $64.70. This yields a potential return of 12% over the current price. This price target is derived from the chart pattern of the “double bottom” theory.
According to this theory, the lows of May 5 and May 13 of this year formed a “double bottom” chart pattern, and the 50% projection from the lowest point of this chart pattern to its neckline yields a price target of $67.40.
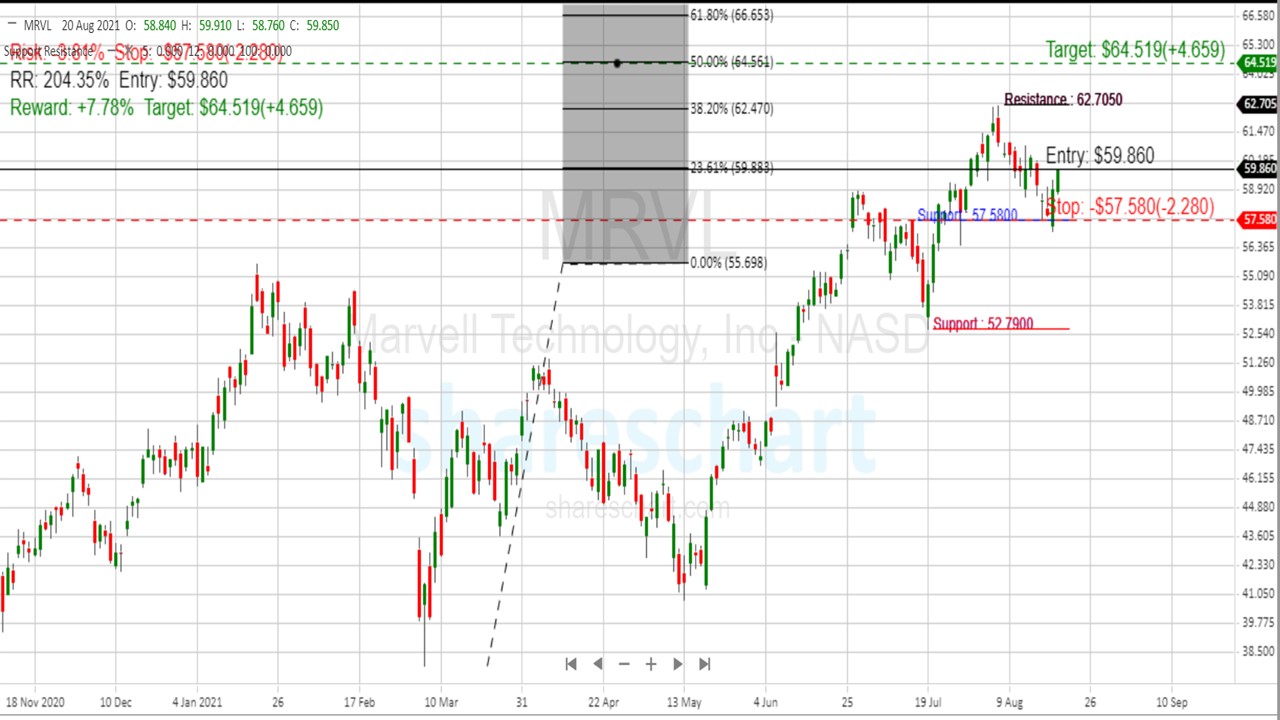
Looking at $64.70 as the next price target, an entry at the current level with the same stop-loss level results in a risk-reward ratio of over 200%.

According to the “double bottom” theory on the chart, the price could reach the 100% “trough-to-neck” projection of $73.60. However, this is a long-term view that we take from the chart perspective.
